Co-buying & Co-owning a Home 2023 Report
Home co-ownership involving friends, family, and couples is rising. Co-buyers account for 26.7% of all home purchases, and 53 million people live in co-owned homes.


📊 Looking for the latest? Read CoBuy's 2026 National Report on Co-buying & Co-ownership →
Quick links:
Definitions
A co-buyer is someone who buys a home with a friend, relative, or partner who is not their spouse.
Co-buying is the process of buying a home as co-buyers, which is structurally unique and considerably more challenging than the traditional home-buying process.
A co-owner is someone who shares ownership interest in a home with anyone to whom they are not married.
Co-ownership is homeownership that involves co-owners. Also referred to as shared homeownership or joint homeownership.
Methodology
In a comprehensive 2023 study on shared homeownership, CoBuy, Inc. surveyed 1,419 U.S. adults across 443 groups of co-buyers and co-owners from 47 states and Washington, D.C. Groups were composed of friends, relatives, and couples falling into one of two categories: (1) co-buyers who plan to jointly purchase a home within the next 24 months or (2) co-owners who currently share ownership interest in a residential property. Participants responded to a combination of open and closed-ended questions during the second and third quarters of 2023. Results have been edited for style and clarity.
Foreword
We started CoBuy in 2015 at our kitchen table. As relatives, we wanted to continue to live together and to become homeowners. Pooling resources seemed an intelligent way to boost our purchasing power and share expenses. As finance and real estate professionals, we assumed co-buying would be straightforward.
We were wrong.
We learned that buying a home together is complicated. There are many unknowns, and closing on the purchase is just the start of co-ownership. Our experience highlighted how traditional real estate fails “non-traditional” buyers and ignores co-ownership.
So we decided to fix it.
A lot has changed since we published the first-ever report on co-buying. In our last report, we focused exclusively on co-buying. This year, we dive deeper.
Why are we publishing this report?
1. Homeownership is now a pipe dream for 115 million renters.
- Home prices have soared 51% in just five years1
- Mortgage rates have more than doubled in two years, rising to a 22-year high2
- The shortfall of homes nationally is at least 6.5 million, and rising3
- The home price-to-income ratio is at an all-time-high4
- The likelihood of a US recession has increased5
And yet, three in four US residents want to own a home. The resurgence of co-ownership is no coincidence; affordability remains the biggest obstacle to homeownership. Teaming up with friends, family, or a partner increases your purchasing power by 50% in major metros. Co-ownership can accelerate the path to homeownership, but it’s difficult, risky, and inefficient.
2. Information asymmetries around residential real estate and consumer finance persist, and established players use these to their advantage.
This must stop. We started CoBuy to level the playing field, and our mission is simple: to make co-ownership a viable path to sustainable homeownership and wealth creation.
Knowledge is power, and it’s time to share.
Matt & Pam
CoBuy Co-founders
Overview
Co-buying: multi-party asset purchases are tough
Buying a home in America takes 4.5 months6 and involves 11+ parties on average. Co-buying is more complex. The systems that support home-buying and homeownership are built for the traditional nuclear household—married couples. Co-buyers have to navigate institutional frameworks that are purpose-built for others, not them.
Without support or guidance, tackling a complex version of the home-buying process means higher costs, greater risk, and added stress. Co-buyers often turn to their real estate agent or loan officer for assistance. These professionals are neither qualified nor economically-incentivized to guide multi-party asset purchases efficiently and effectively.
Difficulty aside, we estimate that co-buyers will account for 26.7% of all US home purchases in 2023. Co-investing in a home is challenging and requires considerable capital, time, and effort—so what motivates co-buyers? Most indicate that financial factors are a significant consideration, showing an increase of 14 percentage points.
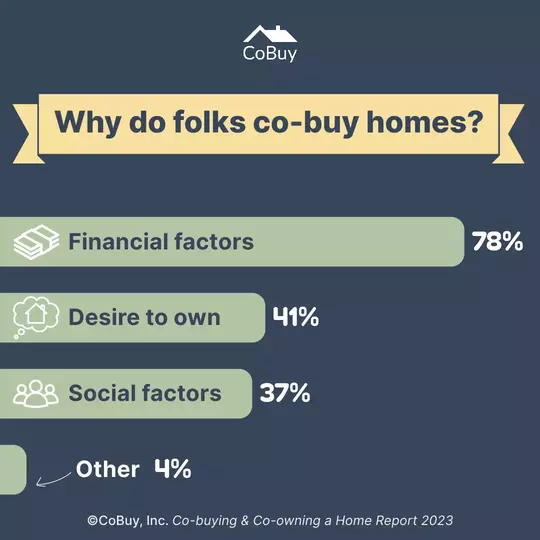
The rank-ordering of motivations looks a little different this year. Social factors fall a spot, and we see an even higher emphasis on financial factors. In our experience, the decision to buy and own a home together is dynamic and often attributable to multiple drivers.
Co-buying is aspirational. By definition, co-buyers have not yet sealed the deal. Many folks who start this journey cannot get through the process. Naturally, many see it as a transaction with a clear end goal: closing on a home purchase. Closing the deal is commonly given complete focus and considered the sole metric for success. In reality, closing on a home purchase is just the start.
Co-ownership: multi-party asset management is challenging, too
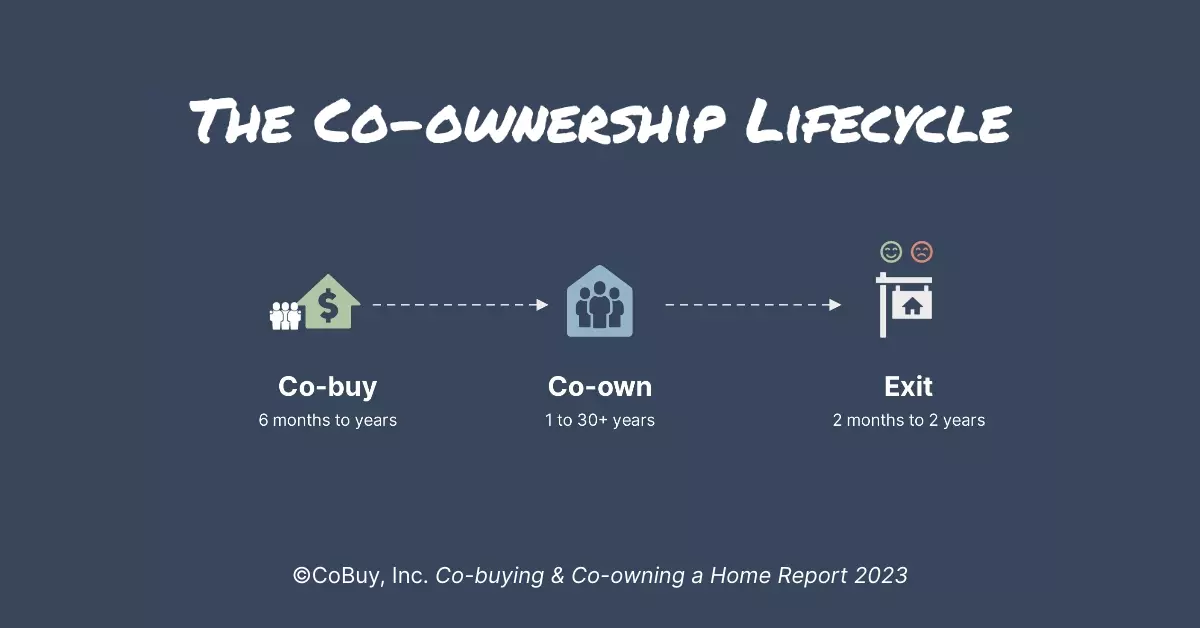
While co-buying leads to co-ownership, owning a home together is a different ball game. For folks who get through joint home purchases, the focus immediately shifts from navigating a purchase together to co-managing a shared asset and home.
At the co-buying stage, the paradigm is theoretical, the timeline for success is short, and the objective is to close on a joint home purchase. Pulling the plug is relatively easy. At the co-ownership stage, the paradigm is real, the timeline for success is longer or open-ended, and the objectives are complex. Exiting the arrangement becomes more complex without a well-defined exit strategy.
Success at this stage can be thought of as Return on Investment (ROI) where investments are financial capital (money), social capital (relationships), time, and energy. Not everyone who chooses joint homeownership is motivated solely by financial Return on Investment, but no one aims to lose money, damage relationships, waste time, or create stress.
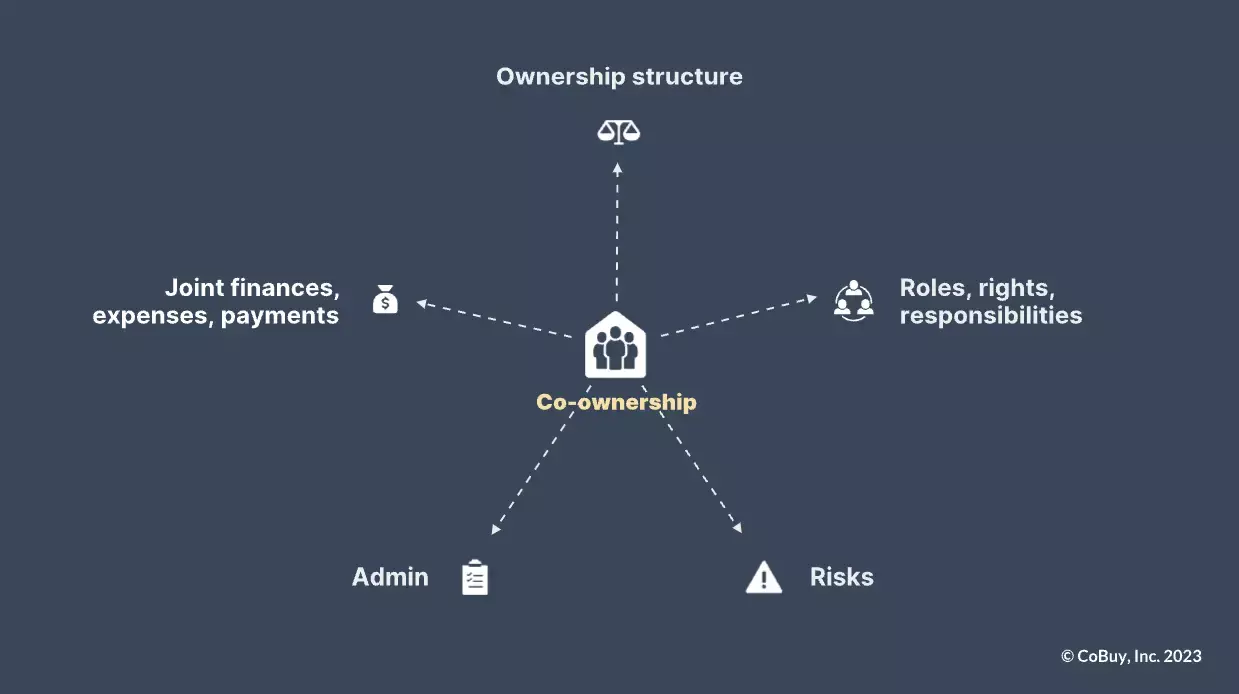
Co-owners must also manage many moving parts while navigating financial, legal, tax, and accounting systems poorly suited to their needs. Like co-buyers, they lack guidance and support.
We estimate that 53 million US residents now live in co-owned homes. For most of these folks, the jointly-owned home represents their largest asset, largest liability, and residence.
Pain points
In this year’s survey, we asked folks where they most need help and provided a uniform set of multiple-select options for both co-buyers and co-owners. Both groups indicated a wide range of needs.
Co-buying
Feedback from folks teaming up to buy a home together is clear: they need help. The most frequently asked question we hear from customers remains how does it work? Other common questions relate to requirements, financing, the mortgage process, individual contributions, and structuring ownership of the property.
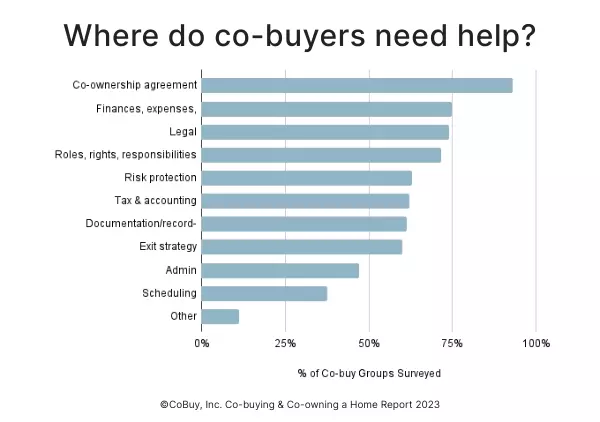
Compared to our 2021 report, the proportion of co-buyers thinking about exit strategy has risen by nearly 20 percentage points. That’s a good thing. We can't confirm why more co-buyers are now interested in exit strategies. Still, based on our fieldwork and customer interactions, we can make an educated guess. We believe several factors have triggered an increased sensitivity to risk: the pandemic, a period of high inflation, and an increasingly uncertain macroeconomic landscape.
Co-ownership
Co-owners also need help across the board.
The vast majority of co-owners say they need help with their agreements. The Co-ownership Agreement is a living document which, on its own, is just an artifact. The significance of this document lies in what it represents: dynamic consensus between co-owners built and maintained through structured decision-making. It is foundational to the co-ownership arrangement as it creates a blueprint for multi-party asset management and safeguards for everyone involved.
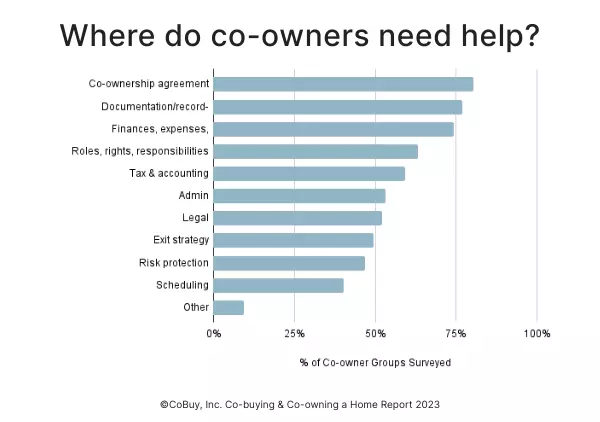
In contrast to co-buyers, more co-owners said they need help with the areas that relate to operational aspects of shared homeownership—documentation and record-keeping, tax and accounting, and admin. This makes sense. Practical considerations are more likely to get mindshare after folks achieve co-ownership and face these issues.
94% of co-buyers say they need help.
Find out where your group stands—before you commit.
Get your CoBuy Decision Brief™ →
$250 per group
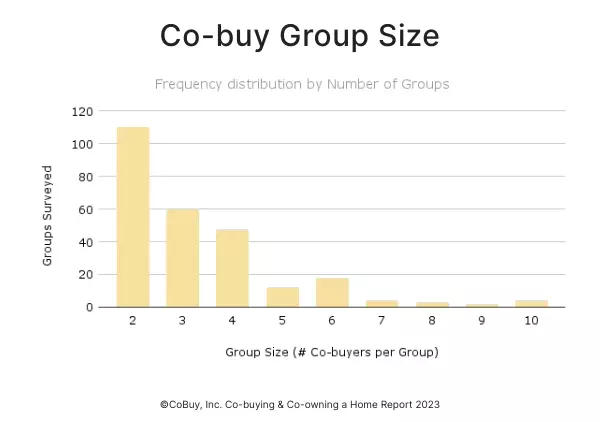
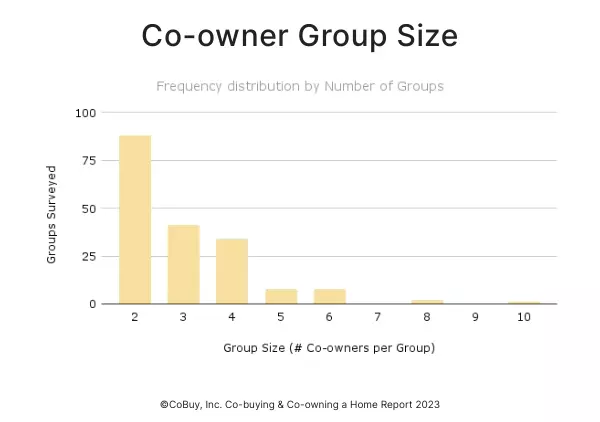
Group size
We asked survey participants to share the size of their respective groups.
Group size refers to the number of co-buyers or co-owners, excluding children, dependents, or renters. With this metric, we’re looking at the number of adult stakeholders per group. That means documented participation in the home purchase, Title, and mortgage, if applicable.
Occupancy status is not a criterion: someone can participate as a co-buyer and co-owner and choose not to live at the property.
Co-buyers
The average size of a co-buy group is 3.3 people—consistent with our primary data going back to 2017. Co-buy group sizes range from two to ten co-buyers, with most groups reporting two to four members.
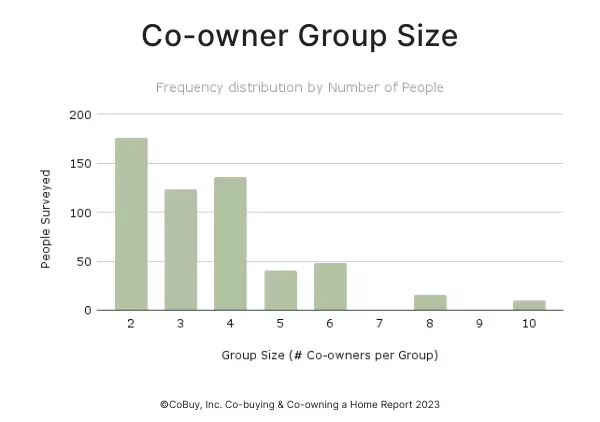
If we look at the frequency distribution of responses by the number of people, we can see that a meaningful proportion of co-buyers belong to groups with more than four members (32%).
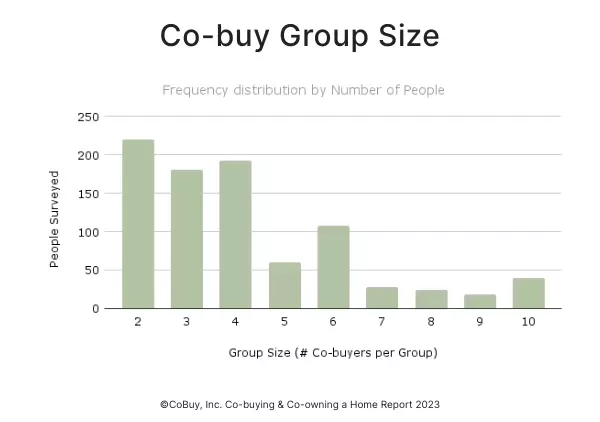
Co-buying as a larger group poses challenges. In our experience, 95% of groups with six or more members do not complete a home purchase together; they split, downsize, or decide not to move forward. These groups face two significant hurdles:
- Alignment: building consensus, coordinating logistics, and cooperating are challenging for larger groups.
- Financing: securing traditional financing from residential mortgage lenders is challenging with 6+ co-borrowers.
Co-owners
The average size of a co-owner group is 3.0 people, excluding children, dependents, and renters. Of the co-owner groups surveyed, nearly 90% have two to four co-owners in total.
Comparing co-buy group size data to co-owner group size data, we see two small but meaningful differences:
- The average group size is 10% higher for co-buyer groups.
- The proportion of groups with more than five people is 100% higher for co-buyer groups.
These discrepancies support our observations from the field: larger co-buy groups often split up, give up, or take another route before completing a purchase.
Relationships
We asked survey participants about the composition of their groups in terms of relationship types. The options available were:
- Friends
- Family members
- Partner (unmarried)
- Partner (married)
- Other
Shared homeownership is not confined to one group, nor do groups always count only one relationship type between members. At CoBuy, we’ve worked with groups composed of every combination of friends, relatives, unmarried couples, and married couples imaginable.
Co-buyers
Compared to our last report, we see a notable increase in co-buy groups that include friends.
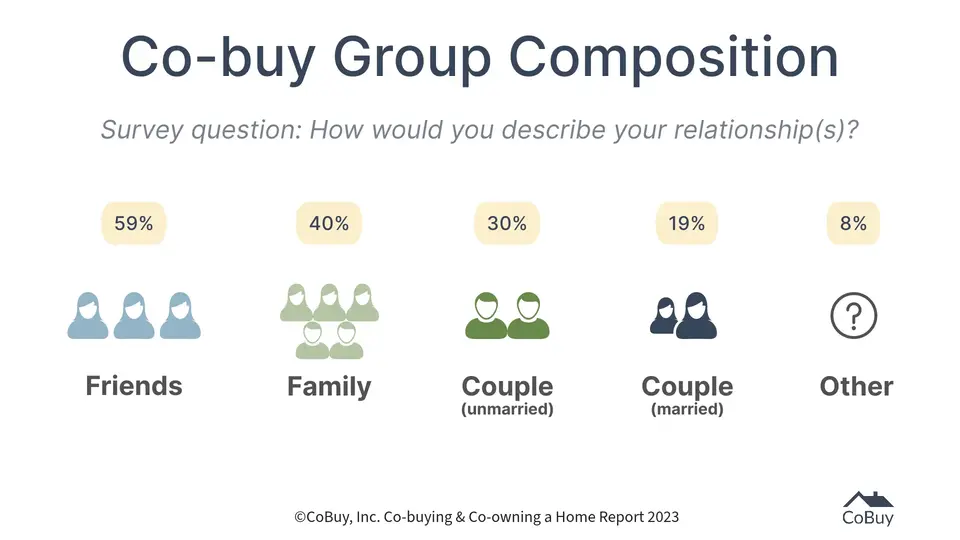
Co-buy groups are diverse. More than half of these groups count two or more relationship types between their members. If we look at the frequency distribution of unique combinations by relationship type, we see there’s a broad spectrum of mixed groups.
Co-owners
At first glance, our survey data for co-owner groups looks similar.
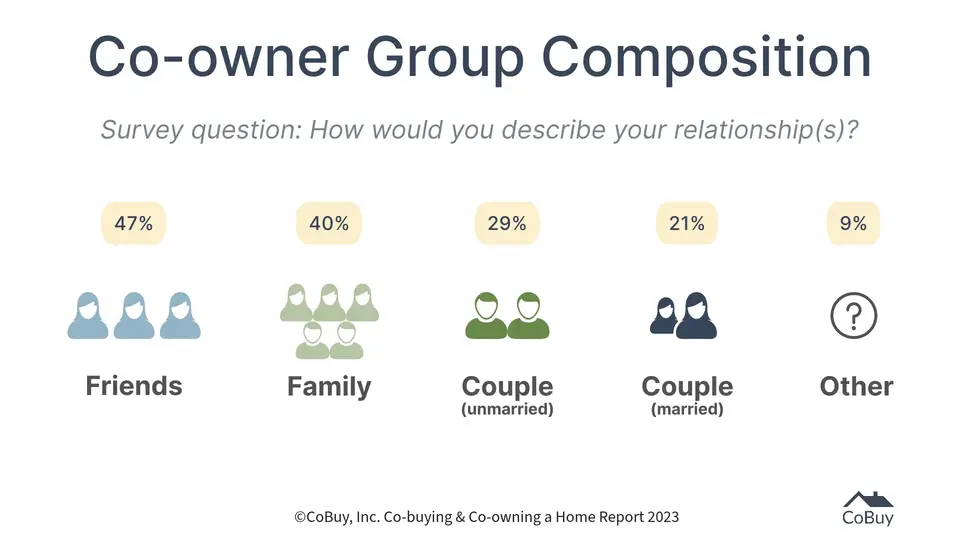
The breakdown of relationship types in co-owner groups reveals several key differences:
- The proportion of groups that include friends and the relative number of friends are lower for co-owner groups vs. co-buyer groups. In our opinion, this is a function of the aspirational nature of co-buying. Planning to purchase a home with your two best friends is easier said than done. Note: this is potentially even more relevant for friends versus folks who share family ties or romantic bonds.
- The proportion of groups exclusively composed of family members is higher for co-owners (20%) than for co-buyers (13%). We could attribute this to the strength of family ties. As they say, “blood runs thicker”.
- The relative number of family members is higher for co-owners.
Mixed groups that count more than one type of relationship between members are common both pre-purchase and post-purchase. If we look at groups in terms of unique combinations by relationship type, we see that groups composed of only one relationship type have the highest frequency.
Occupancy
In shared homeownership, not all participants necessarily live in the home.
We asked survey participants about occupancy. For co-buyers, who plans to live in the home? For co-owners, who lives in the home? Respondents were asked to choose one of the following options:
- Some of us
- All of us
- None of us
- Other
Co-buyers
More than half of co-buyers plan for one or more group members to live at the property.
Surprisingly, there is an increase in the incidence of groups who report no group members plan to live at the property (36.4%). This implies that either (i) these folks plan to be non-occupant investors or (ii) they are purchasing the property as a second home or vacation home.
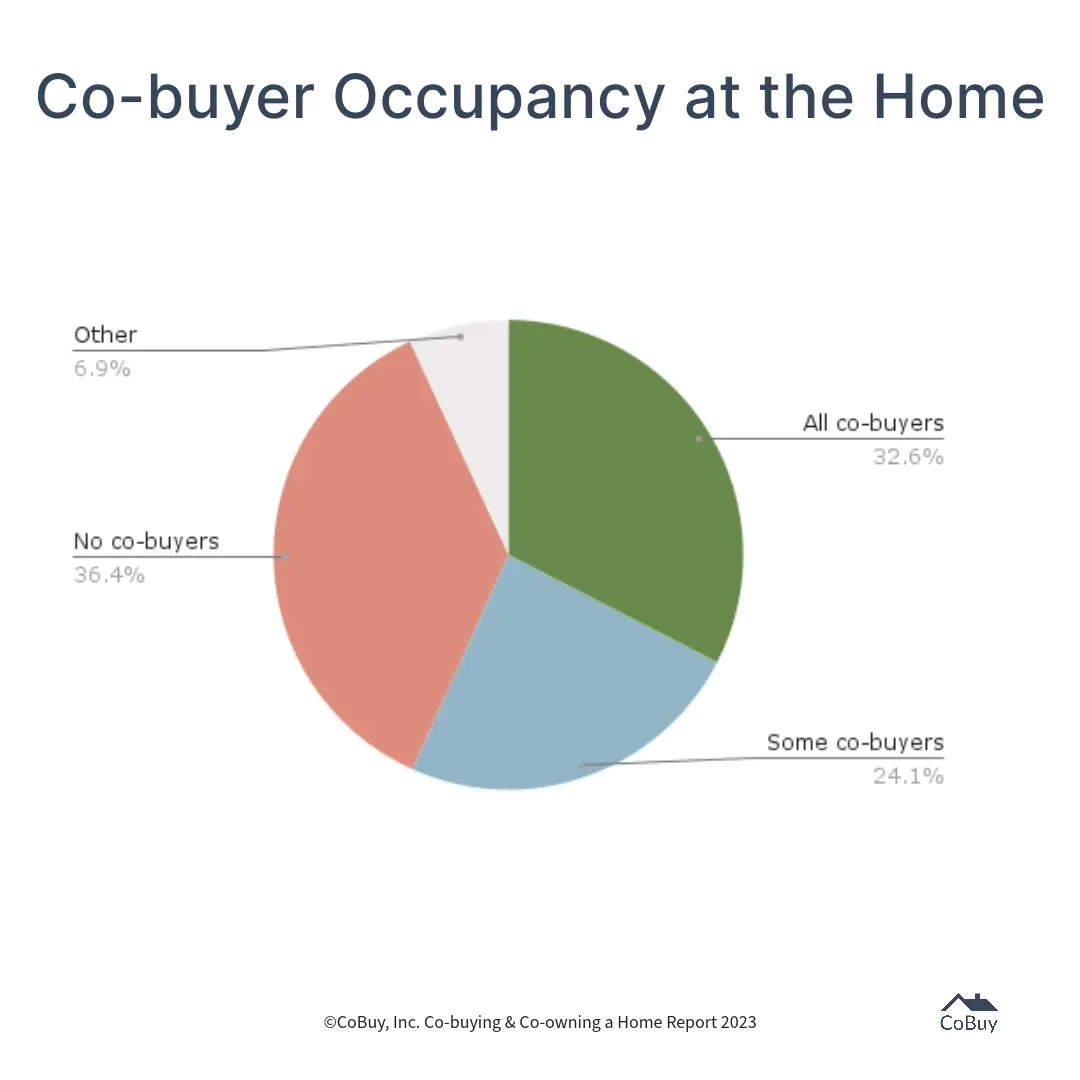
At CoBuy, we see a trend where folks from high-cost West Coast metros co-buy a home out of state for investment purposes. Many have substantial incomes, can’t afford to buy a primary residence in their home geography, and want to become homeowners. Some of these folks can achieve this goal by leveraging the economies of scale of co-buying and targeting lower-cost housing markets.
Co-owners
Two-thirds of co-owners say that at least one member of their group lives at the co-owned home, and the most common response was all co-owners (live at the co-owned home).
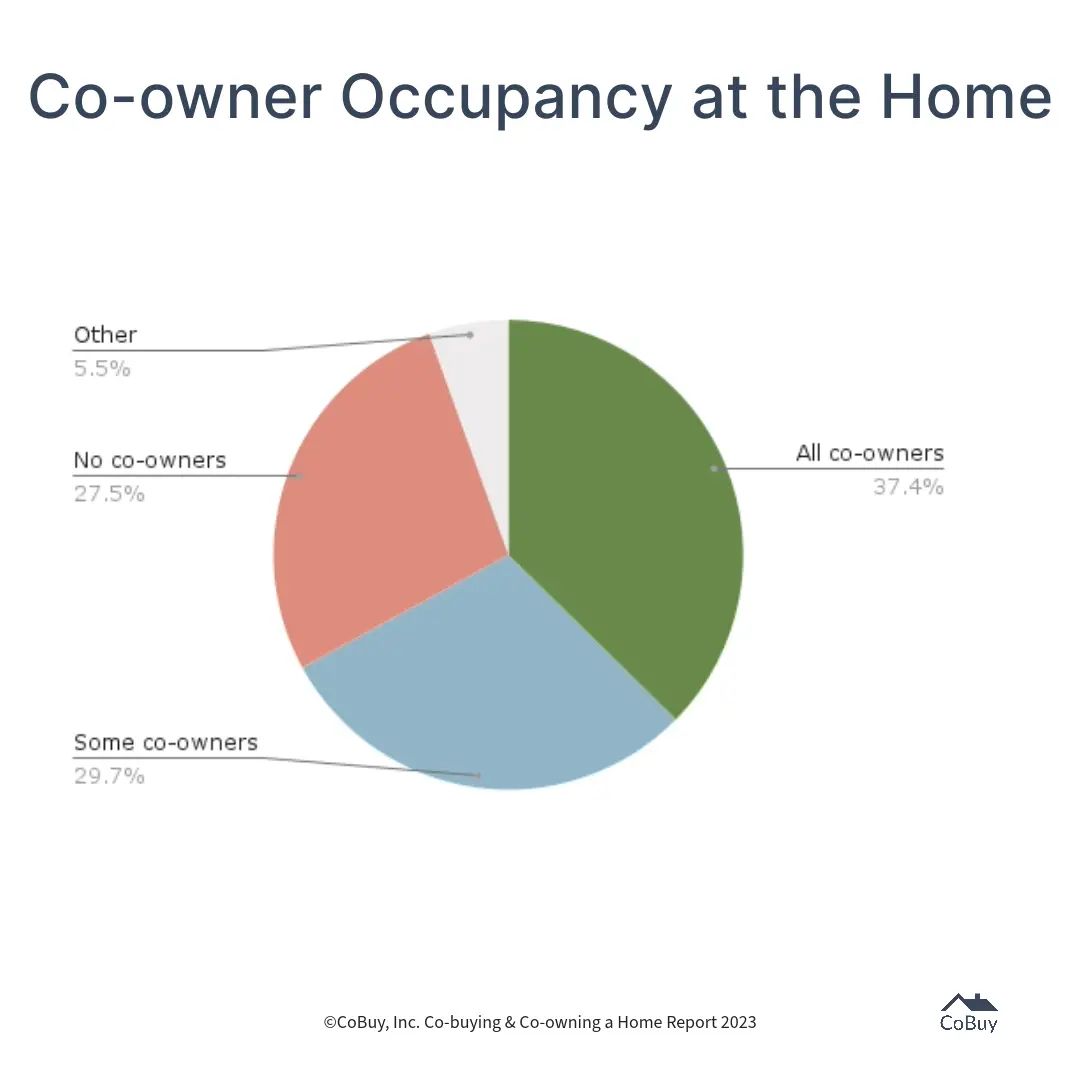
Responses from co-owners track more closely with our expectations based on fieldwork and past surveys.
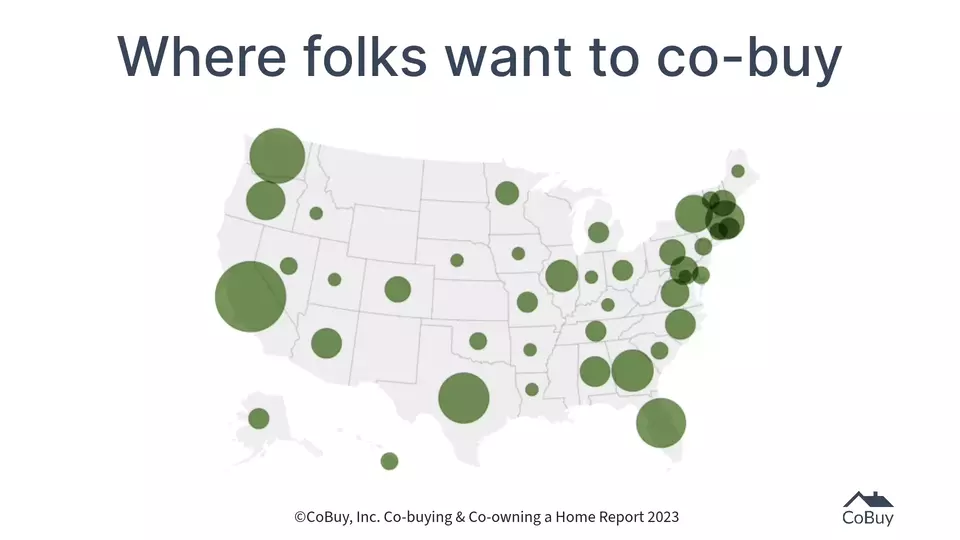
Geographies
Shared homeownership spans state lines and location types, from San Francisco, California, to Bell Buckle, Tennessee—and many places in between.
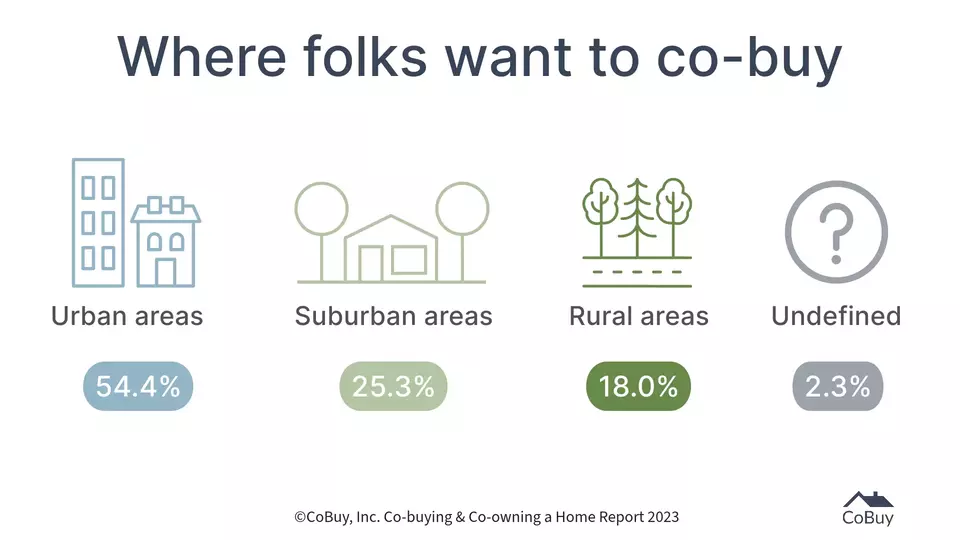
Co-buying
Survey respondents plan to purchase in 42 states and the District of Columbia. California, Washington, Texas, New York, and Florida topped the list in outright number of responses, but we see strong interest across the country on a population-weighted basis.
Co-buyers are targeting homes across urban, suburban, and rural areas. Co-buying across these location types is closely correlated to population distribution.
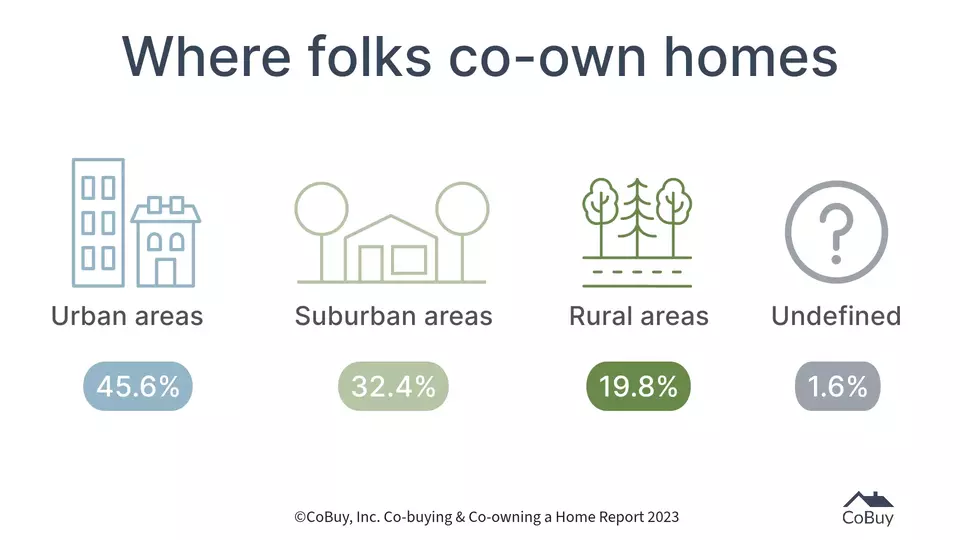
Co-ownership
Co-owners who responded to our survey own homes in 42 states and Washington, D.C., though the coverage of states and distribution of responses varied slightly from the co-buyer groups. The top states were California, Washington, Texas, Florida, and Pennsylvania.
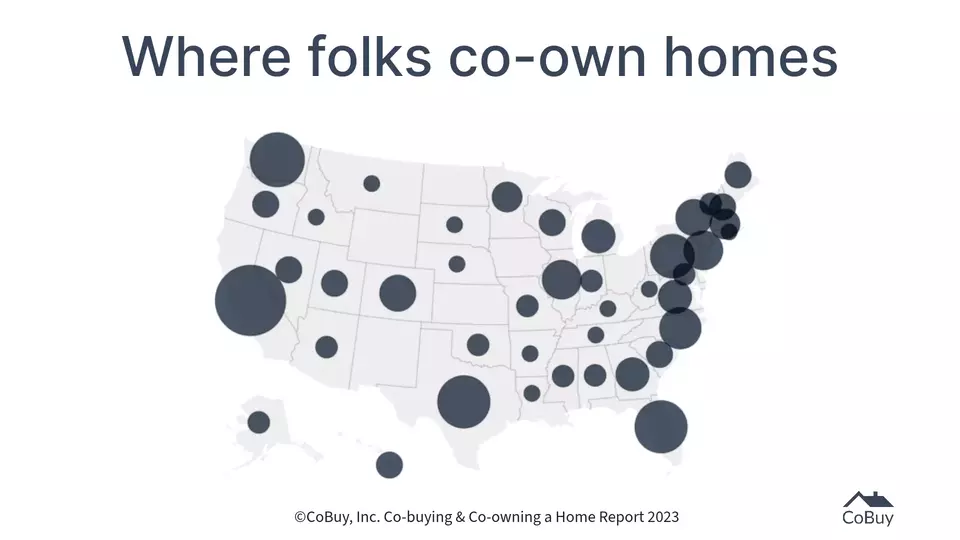
The incidence of co-ownership is spread across location types, from urban cores to rural areas. Suburban and rural geographies are slightly better represented among the post-purchase cohort. Considering about 19% of the US population lives in rural areas, it’s clear that co-ownership isn’t just an urban phenomenon.
Insights from the field
- The market increasingly views co-ownership as a financial investment, regardless of whether or not the property serves as a primary residence for any or all group members.
- Interest in co-buying multi-family homes is on the rise. Over 60% of co-buyers surveyed said they are targeting or would consider buying a multi-family home, including those searching for a primary residence who would consider renting out other units.
- Primary and secondary research suggests informal and unreported shared homeownership arrangements are common. If true, our estimates of aggregate co-buying and co-ownership at the national level are low.
- Multi-generational co-ownership is gaining popularity as market dynamics squeeze the supply of starter homes and more Baby Boomers enter retirement.
Outlook
Buying and owning a home together are complex undertakings. Shared homeownership is here to stay and likely to increase in popularity.
The market needs more—and better—education, tools, and resources for shared homeownership at each stage. Without a framework and support (a) to guide the co-buying process and (b) to manage co-ownership over the complete lifecycle:
- Access to joint homeownership as a viable pathway to owning a home is limited
- Co-buyers and co-owners will continue to incur unnecessary costs and risk
Closer collaboration between real estate professionals, businesses, lenders, housing authorities, and government is warranted at all levels. Initiatives that adopt a consumer-first approach are universally beneficial and can yield positive results for all stakeholders:
- Improved access to homeownership for consumers
- New channels of revenue generation for businesses
- Increased lifetime customer value for financial institutions (via wealthier borrowers, account holders, and policy holders)
- Increased tax revenue for local, state, and national government
- Expanded options for repurposing urban, commercial, and rural property for all stakeholders
Finally, we need to examine high-impact/low-effort levers to support friends, relatives, couples, and groups who aspire to own a home together. We suggest adapting lending standards, adopting policies that make better use of the existing housing stock, and overhauling outdated approaches to zoning.
The data is clear. Structure beats optimism.
Agreements, expenses, exit planning—all in one place.
Get your Co-ownerOS™ Annual Pass →
$1,000/year per group · Agreement, expenses, equity, exit planning
ℹ️ About CoBuy
CoBuy is a WealthTech company created by veteran finance and real estate professionals to unlock homeownership and wealth creation for friends, family members, and couples. We’ve spent 51,500+ hours tackling co-ownership and helped 1000s to navigate the co-buying process to make co-owning a home simpler, safer, and a smart investment.
This report and its contents are copyrighted by CoBuy, Inc. You may reproduce content contingent upon proper attribution to CoBuy and a direct link to this page. For questions and press inquiries, contact us here.
References
1 S&P Dow Jones Indices LLC, S&P/Case-Shiller U.S. National Home Price Index [CSUSHPINSA], retrieved from FRED, Federal Reserve Bank of St. Louis; https://fred.stlouisfed.org/series/CSUSHPINSA, September 25, 2023.
2 Primary Mortgage Market Survey® data provided by Freddie Mac, https://www.freddiemac.com/pmms/pmms_faqs, September 25, 2023.
3 CNN, The US housing market is short 6.5 million homes, https://www.cnn.com/2023/03/08/homes/housing-shortage/index.html, March 8, 2023.
4 FRED, Federal Reserve Bank of St Louis, U.S. Census Bureau, retrieved from Longtermtrends; https://www.longtermtrends.net/home-price-median-annual-income-ratio/, September 24, 2023.
5 Panday, Satyam. "Risk of Recession in U.S. Remains Elevated." Wall Street Journal, https://www.wsj.com/articles/risk-of-recession-in-u-s-remains-elevated-4602559f, September 20, 2023.
6 Zillow, https://www.zillow.com/learn/how-long-does-it-take-to-buy-a-house/, retrieved September 25, 2023.
How to cite
Preferred citation: "Co-buying & Co-owning a Home 2023 Report," CoBuy (cobuy.io/blog/cobuying-coowning-home-2023-report).
Plain-text form: Co-buying & Co-owning a Home 2023 Report, CoBuy, cobuy.io/blog/cobuying-coowning-home-2023-report.
Example: “26.7% of U.S. home purchases involved co-buyers (the CoBuy Co-buying Rate™) in 2023, per CoBuy's 2023 report.”
© 2026 CoBuy, Inc. Citation & reuse. You're welcome to cite these figures and grades for editorial, educational, or personal use with attribution to CoBuy and a clean, followable link to this page: standard hyperlinks only, with no nofollow, noreferrer, or sponsored qualifiers and no redirect wrappers. Commercial use is by license only: republication at scale, resale, syndication, or inclusion in any commercial product, dataset, or AI training corpus requires a license from CoBuy, Inc. Charts and scorecard graphics must keep the embedded source line intact. Licensing: contact.